
On this page
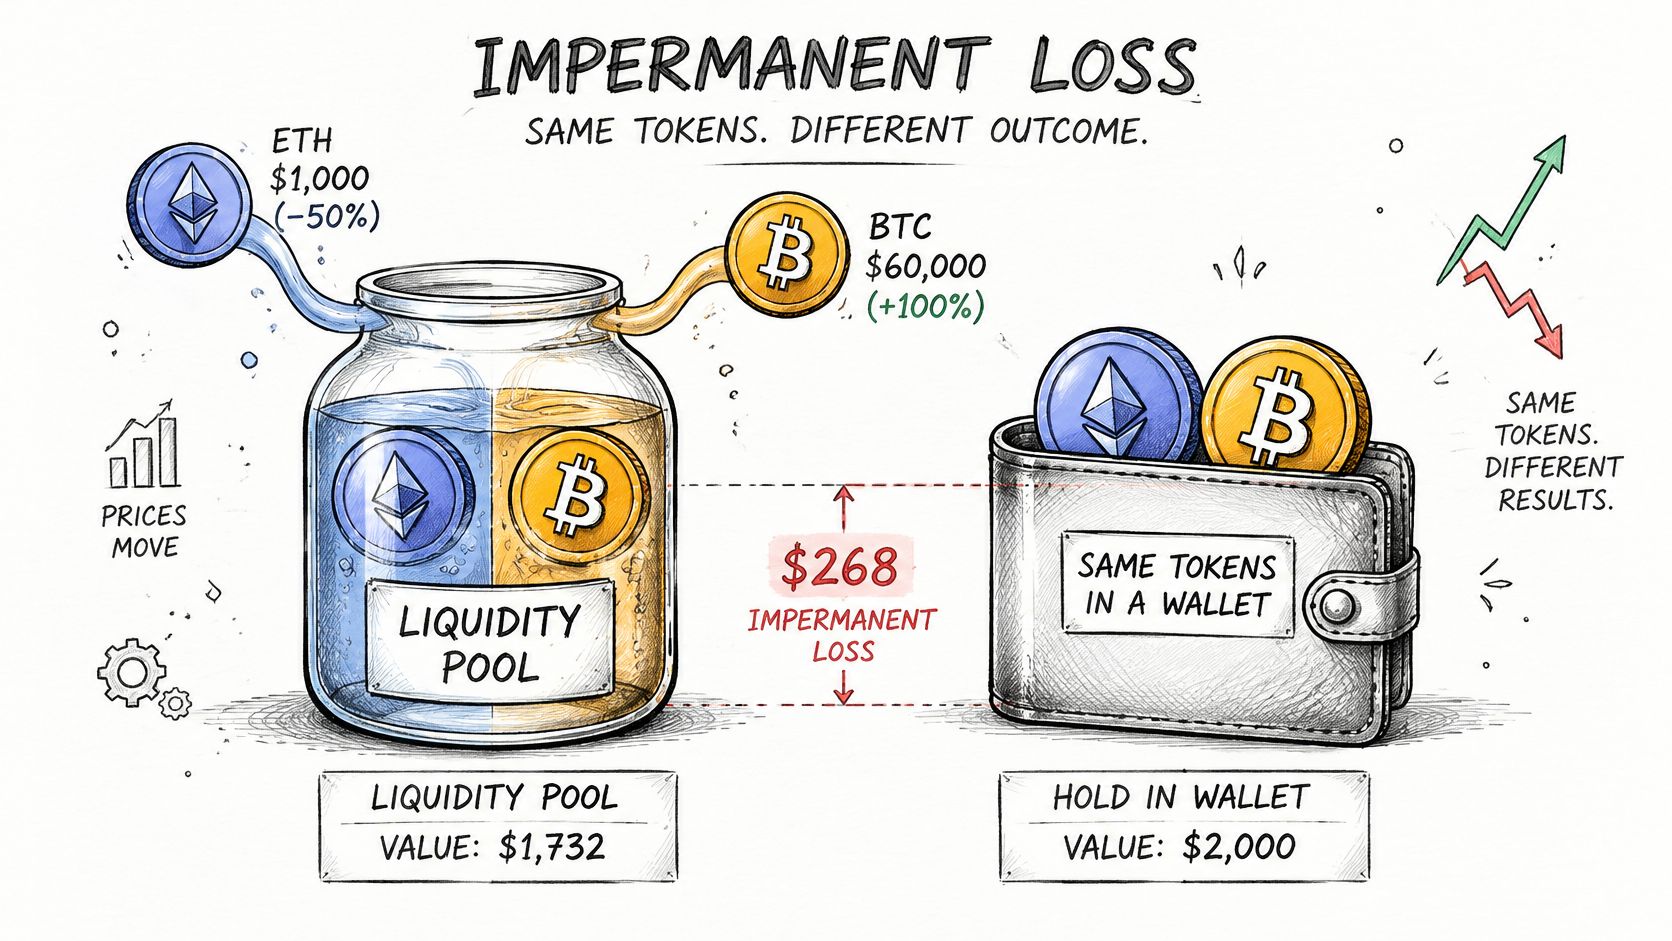
Impermanent loss is the gap between what your tokens are worth inside a liquidity pool and what those same tokens would be worth if you had held them in a wallet, measured after one token's price has moved against the other. The gap depends only on how far that price ratio traveled. A 2x move leaves a standard two-token position about 5.72% behind holding, and a 100x move leaves it roughly 80.2% behind.
Say you moved $10,000 into an ETH and USDC pool when ETH traded at $3,000 and collected fees for a quarter. ETH then ran to $4,500. Your position is worth more dollars than you deposited, and it's still worth less than the same tokens would have been worth sitting untouched in a wallet the whole time.
That difference is the subject of this guide, and it has two properties most yield screens hide. It has a size you can compute in advance, and it shrinks or grows with the time you stay in the position.
The usual explanation stops at a percentage and a formula. This one turns impermanent loss into a break-even race against your fee income. Once you know how big the loss is in dollars, the only remaining question is the fee APR the pool must earn to recoup that loss inside the window you plan to hold, after the costs of getting in and out.
Table of Contents
- What Impermanent Loss Means in Plain English
- How the Constant Product Formula Creates the Loss
- How to Calculate Impermanent Loss Step by Step
- When Trading Fees Offset Impermanent Loss
- Stable Pairs Versus Volatile Pairs
- Concentrated Liquidity Changes the Shape of the Loss
- Risks Beyond Impermanent Loss to Check
- Run Your Numbers Before You Deposit or Move
What Impermanent Loss Means in Plain English
Think of a market stall that swaps apples for oranges with every customer, always pricing fruit by how much of each sits on the counter. When oranges get expensive elsewhere in the market, customers keep arriving with oranges and leaving with apples. By evening the stall holds a pile of apples and fewer oranges than the owner started with, and the whole basket is worth less than the untouched original basket would have been. A liquidity pool runs that stall automatically, on every swap, with your tokens.
The whole comparison in one line: impermanent loss is the value of your pool position at current prices minus the value of the exact same tokens, in the exact same starting amounts, held outside the pool at those same prices.
Two confusions trip people up. First, impermanent loss isn't a fee, a gas cost, or a slice taken by the protocol. Nothing is deducted. The composition of your position changed because traders bought the asset that rose, and you were left holding more of the one that lagged. Second, it isn't a token that disappears. Your LP tokens stay in your wallet, and the position can be worth more dollars than you deposited while still trailing the hold benchmark.
The word "impermanent" is doing specific work. The loss is measured against today's prices, it changes as the ratio changes, and it only locks in when you withdraw while the ratio is still off. If the pair returns to the ratio you entered at, the loss goes to zero before fees. If you exit at the bottom of a divergence, you keep it permanently.
Anyone in a two-token pool carries this, including people who only wanted yield on stablecoins. The two assets don't both have to move. One moving against the other is enough, which is why a USDC and USDT pool behaves very differently from a SOL and USDC pool. The beginner guide on Yield.ly Learn covers the surrounding vocabulary, and the glossary of related terms and definitions is worth keeping open, alongside a plain liquidity pool explainer if you want the mechanics before the math.
How the Constant Product Formula Creates the Loss
Most automated market makers hold two tokens and enforce a simple rule: the amount of token A multiplied by the amount of token B stays constant.
In plain words: the pool can't change how much total value it holds, only the mix. Someone who wants token A must add token B, and the mix shifts to keep the product steady.
Written out, that's x times y equals k, where x and y are the pool's balances and k is a constant while nobody is depositing or withdrawing. When buyers take ETH out and put USDC in, ETH becomes scarcer inside the pool and prices up. The provider ends up holding less of the asset that appreciated. That's the entire mechanism behind the loss.
The two-token result can be written without knowing the deposit size at all. If r is the price of one token relative to the other now, divided by its price ratio when you deposited, then impermanent loss as a fraction of hold value is:
2 times the square root of r, divided by (1 plus r), minus 1
Everything cancels except the ratio. A $500 position and a $5 million position with the same price move suffer the same percentage. And because the formula only sees magnitude, an r of 0.5 (one token halving) produces the same result as an r of 2.
A worked table with hypothetical numbers
The basis for every row: a $5,000 and $5,000 deposit, one price move, no fees and no gas. Hold value is 5,000 plus 5,000 times r. Pool value is 10,000 times the square root of r.
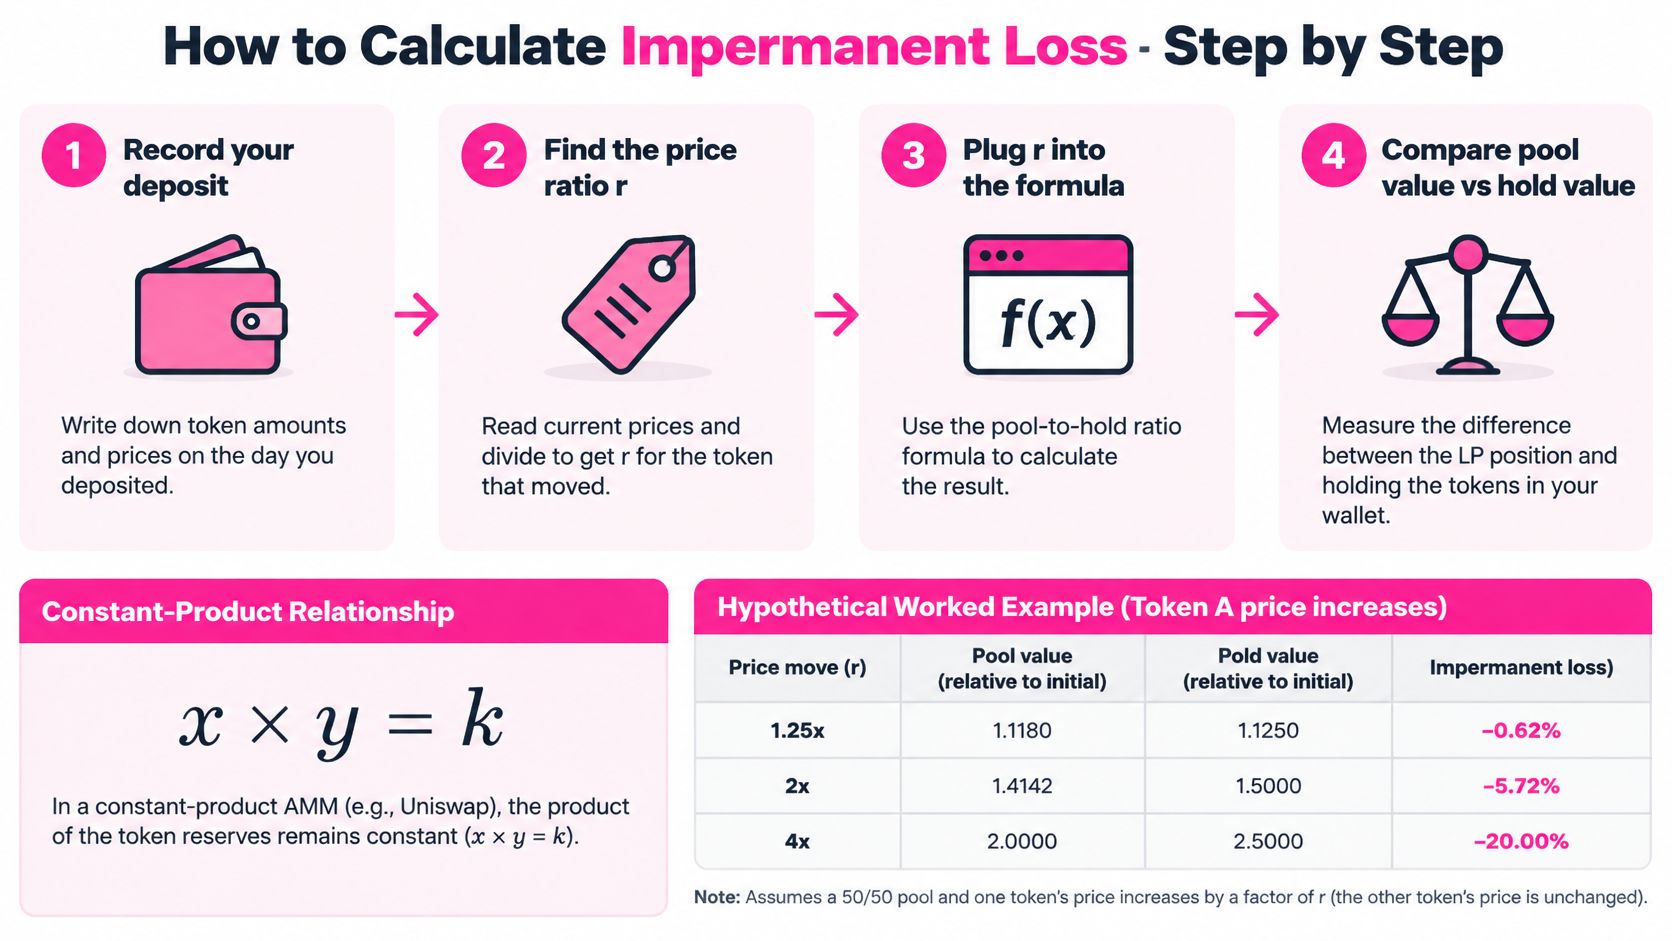
| Price move of one token | Ratio r | Pool vs hold (impermanent loss) | Gap on a hypothetical $10,000 deposit |
|---|---|---|---|
| 1.25x | 1.25 | -0.62% | -$70 |
| 2x | 2 | -5.72% | -$858 |
| 4x | 4 | -20.00% | -$5,000 |
| 5x | 5 | -25.46% | -$7,639 |
| 10x | 10 | -42.50% | -$23,377 |
| 100x | 100 | -80.20% | -$405,000 |
Walk the 2x row to see where each cell came from. Hold value is 5,000 plus 5,000 times 2, which is $15,000. Pool value is 10,000 times the square root of 2, which is $14,142. The gap is $858, or 5.72% of the hold value. The 100x row lands at about 80.2%, the same figure a 2025 arXiv study of constant product market makers reports at a 100x price increase, as of its 2025 publication.
Why the curve punishes big moves
The relationship isn't linear. A 2x move costs about 5.7% and a 4x move costs about 20%. Doubling the divergence again to 8x roughly doubles the loss once more. Losses accelerate at the tail, which is exactly where volatile pairs spend their worst weeks. That acceleration is also why an LP position is sometimes described as automatically selling the winner: the pool keeps rebalancing as price travels, and the provider keeps ending up with more of the laggard.
One related detail matters if you plan to borrow against a position. LP tokens are often accepted as collateral, and the mechanics there are easier to follow after you understand composability in DeFi lending, where one protocol's receipt token becomes another protocol's input.
How to Calculate Impermanent Loss Step by Step
Here's the sequence, in the order that avoids rework.
- Record the deposit snapshot. Write down the token amounts and both prices on the day you deposited. Without a starting ratio you have no r, and reconstructed snapshots from memory are usually wrong.
- Find r for the token that moved. Read current prices and divide the new ratio by the old one. If ETH went from $3,000 to $4,500 against USDC, r is 1.5.
- Convert r into a pool-to-hold ratio. Plug r into the formula. The output is a number slightly below 1 for any r other than 1, and that shortfall is the loss as a share of hold value.
- Turn the ratio into dollars. Multiply your hold value at current prices by the ratio to get pool value, then subtract from hold value. That difference is your impermanent loss in dollars before fees.
- Add the fees you earned. Pull the figure from the pool's reported fee income or sum your own fee accrual over the same window. Don't substitute the advertised APR, which is a projection, for realized fees.
- Subtract exit and entry costs. Gas, swap fees on the way in, bridge fees if you moved chains, and any early-exit penalty all come off the top. Small positions are frequently wiped out here.
- Compare against the alternative. That means the unpaired balance you'd otherwise hold, or a lending deposit with no divergence exposure. The number that matters is the net figure against that alternative, not the gross return.
The calculation on a real-shaped position
Take a hypothetical 1 ETH and 3,000 USDC deposit made when ETH is $3,000. ETH rises to $4,500, so r is 1.5 and the ratio is 2 times the square root of 1.5, divided by 2.5, which comes to about 0.9798.
Hold value is 1 times 4,500 plus 3,000, or $7,500. Pool value is about $7,348. Impermanent loss is roughly $152 before fees. You can confirm it from the pool side: at that price the position holds about 0.8165 ETH and 3,674 USDC, which is $3,674 plus $3,674, the same $7,348.
Practical rule: if the fees earned over the same period don't clear that $152 plus your exit costs, the position lost to simply holding, even though the dollar balance went up.
For a spreadsheet, put r in cell A1 and enter =2*SQRT(A1)/(1+A1)-1 in B1 to get the pool-to-hold ratio minus one, then multiply by your hold value. Every figure above is hypothetical and computed from the formula, not observed in a live pool.
When Trading Fees Offset Impermanent Loss
Fees are the other side of the ledger, and they accrue per swap rather than per day. A pool's fee APR depends on trading volume relative to pool depth, which is why it spikes during busy weeks and fades when volume moves elsewhere. Treat any quoted fee rate as a snapshot of conditions, not a promise for your holding period.
The break-even question has a clean answer. Divide the impermanent loss as a percentage of hold value by the number of days you're willing to wait, then annualize it:
Fee APR needed equals the loss percentage, times 365, divided by the target number of days.
The recoup table
| Price move of one token | Impermanent loss (% of hold value) | Fee APR needed to recoup within 30 days |
|---|---|---|
| 1.25x | 0.62% | about 7.5% |
| 2x | 5.72% | about 70% |
| 4x | 20.00% | about 243% |
| 5x | 25.46% | about 310% |
Assumptions: hypothetical figures, no compounding, the loss is realized at once, and fees accrue evenly. Change the window and the required rate moves inversely. Recoup a 5x move over 180 days instead of 30 and the required fee APR drops to roughly 52%, but you now carry six months of further divergence risk.
Read the 5x row. A pool must earn about 310% annualized in fees to recover a fivefold divergence inside a month. No realistic fee rate does that, which means the practical defense is avoiding the 5x move in the first place, not chasing yield hard enough to outrun it.
What the historical record shows
An arXiv analysis of Uniswap v3 liquidity positions compared aggregate impermanent loss against fee income across the pools it studied and found aggregate impermanent loss above $260.1 million against roughly $199.3 million in fees, so fees did not cover divergence in aggregate over that period. The same analysis found stablecoin pairs with impermanent loss below 0.003% and more than 97% of trading volume in the lowest fee tier, while volatile pairs saw roughly 3% to 8% impermanent loss during substantial price moves. Those are historical figures from the study period, not a forecast.
That gap between the two pair types is the whole argument for matching the pool to the risk rather than the yield.
High headline yields mislead for a second reason: they often bundle token emissions with fee income. Emissions can be cut, repriced, or diluted, and the reward token can fall while you hold it. Yield.ly separates base APY from token reward APY and shows total value locked, the seven-day change in that TVL and how fresh each data point is, and the methodology behind how opportunities are ranked explains how yield quality, liquidity, observed risk and data confidence feed the ordering. Rates move constantly, which is why the guide on why DeFi APY changes is worth reading before treating any number as durable.
Stable Pairs Versus Volatile Pairs
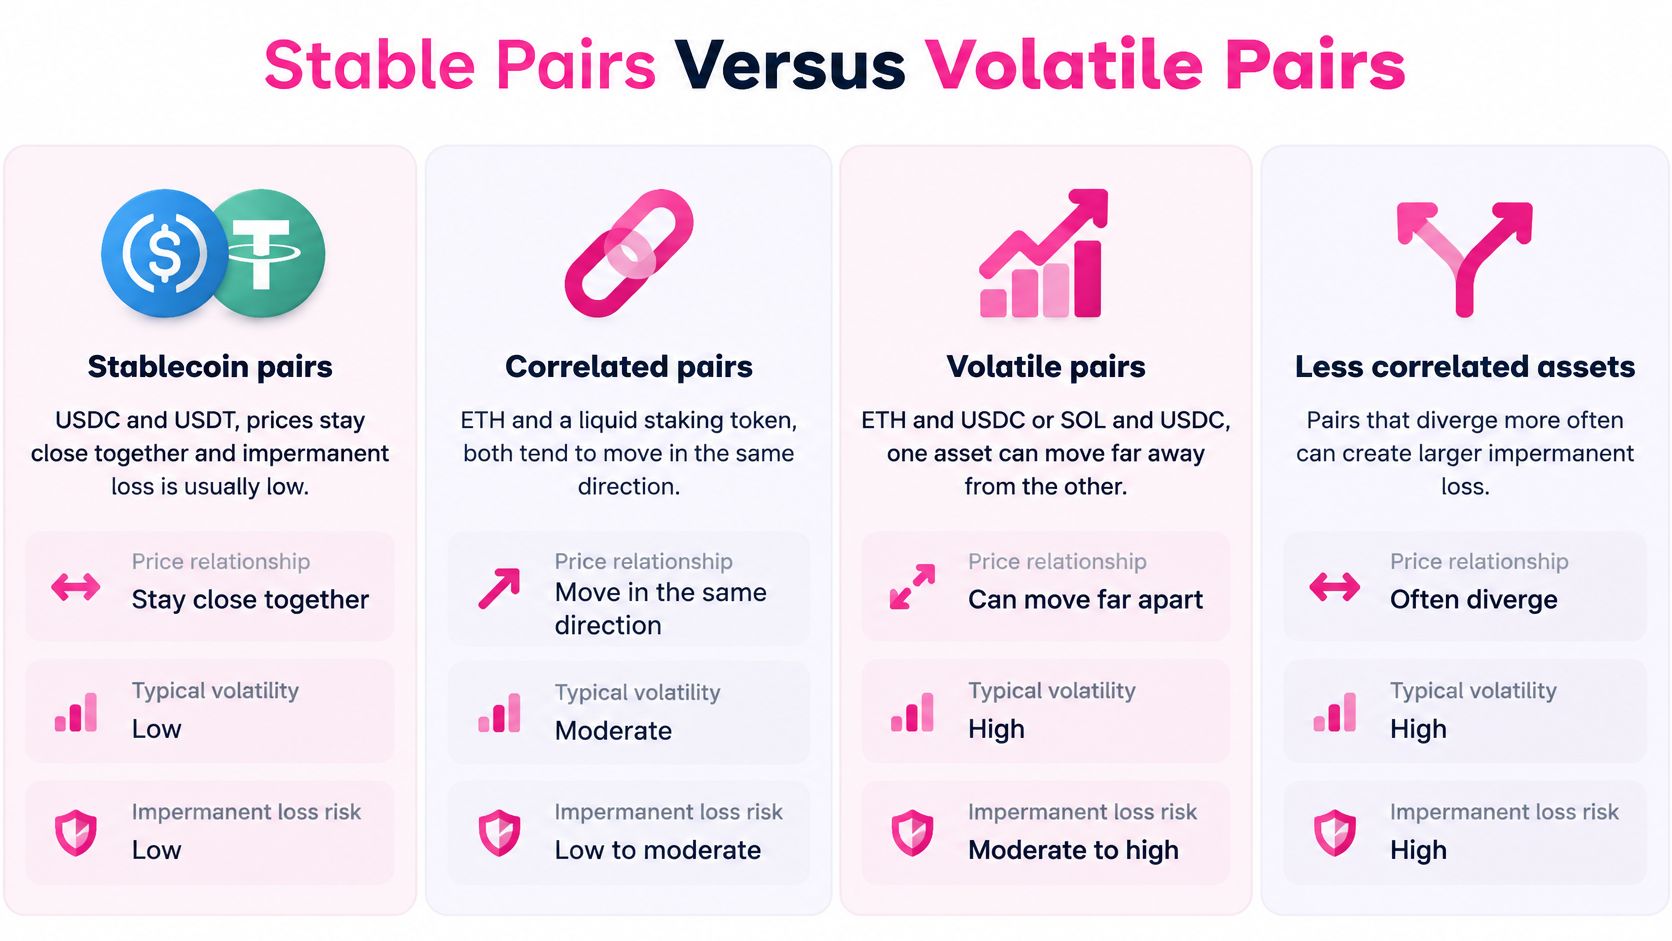
| Pool type | Divergence exposure | Main return source | Main caveat |
|---|---|---|---|
| Stablecoin pair (USDC/USDT) | Very low while both hold their peg | Trading fees and possibly incentives | Depeg and issuer risk replace divergence risk |
| Correlated pair (ETH and a liquid staking token) | Low to moderate, depends on the peg spread | Trading fees plus underlying staking yield | Spread can widen under stress |
| Volatile pair (ETH/USDC or SOL/USDC) | High on large trends | Trading fees and token emissions | Impermanent loss dominates in one-way markets |
| Long-tail token pair | High and hard to hedge | Mostly incentives | Thin liquidity and exit risk |
Stablecoin pairs barely register on the formula. Two assets both pinned near a dollar move by fractions of a cent against each other, so a 1% drift between them produces about -0.0012% impermanent loss, a 5% drift about -0.03%, and a 10% drift about -0.11% (hypothetical outputs of the formula, not market observations). The exposure that harms a stable pool is a depeg, where one side stops being worth a dollar at all. That's issuer and reserve risk, and no pool formula prices it.
Correlated pairs sit in the middle. ETH and a liquid staking token track each other closely in calm markets, and the gap between them widens during stress or queue events. You're compensated with staking yield on the wrapped side, and the risk you're taking is the peg spread, not a directional call.
Volatile pairs are where the formula bites. A one-way market hands you a large loss in weeks while fee volume stays healthy enough to look reassuring. That doesn't make volatile pools irrational. It means the fee income has to be large and the exposure deliberate, sized as a position rather than treated as a savings account.
Long-tail pairs add a cost the formula never shows. When one side is thinly traded, your exit moves the price, and the deep divergence you're trying to escape may be the same condition that makes exiting expensive.
A lower-yield stable pool can deliver more predictable economics than a higher-APY volatile pool. A volatile pool can still be the right choice when fees are high enough and the divergence exposure is deliberate. Choose by situation, not by the APY column.
The side-by-side comparison view puts asset, network, return and liquidity measures in one format, and Curve's stable-focused pools are documented in the Curve DEX protocol reference if you want to see how stable swaps are structured. For readers working through the compliance side of dollar-denominated tokens, these terms for stablecoin payments are a useful reference on what a stablecoin is and isn't promising.
Concentrated Liquidity Changes the Shape of the Loss
Concentrated liquidity works like a spotlight instead of a floodlight. Rather than spreading capital across every price from zero to infinity, a provider picks a range, say ETH between $2,700 and $3,600, and the same dollars work far harder inside it. Fee income per dollar rises while price stays in the beam. Once price leaves the range, the position holds only one token and stops earning fees entirely.
So the honest question isn't whether concentrated liquidity reduces impermanent loss. It's whether it reduces the loss or merely reshapes it into something sharper.
A 2025 study analyzing 700 days of Uniswap v3 liquidity-provision data, as of its 2025 publication, found average impermanent loss of approximately 3.8%. More than half of providers had losses below 0.8%, which sounds reassuring until the next figure: 49.5% of positions produced negative overall returns because realized impermanent loss outweighed rewards. More than half of providers earned total returns between -1% and 1%. That record challenges the assumption that concentration is automatically better than passive holding.
What to check on a range position
- Range width against the fee rate. A tight range with a high advertised fee APR is a concentrated bet on the price staying put. Compare fee APR to loss exposure at the same range width, not in isolation.
- Time out of range. Ask how often the position fell outside its band. Out-of-range time is unpaid time, and it's the number most interfaces don't show.
- Net after rebalancing. Every rebalance is a swap with fees and gas. A strategy that rebalances weekly can spend a meaningful share of the yield it generates.
- Whether the range needs babysitting. Narrow bands demand active management, which imports timing risk and attention cost. That cost belongs in the comparison with a simple hold.
The shape of the loss matters because it changes when you pay it. A wide-range position absorbs divergence gradually. A narrow one absorbs it all at once when price breaks the band, and you're left in a single asset at the moment you least wanted to be.
Uniswap v3 is the reference implementation for this design, documented in the Uniswap v3 protocol reference, and the same range mechanics now appear across many automated market makers. The study above describes past pools. It isn't a forecast for any pool you're considering.
Risks Beyond Impermanent Loss to Check
Impermanent loss sits in a list, not at the top of it. Run these checks before any deposit.
- Smart contract risk. Ask whether the code has been independently audited and how long it has run with real money. An audit is a review of code at a moment in time, not a warranty against exploits.
- Depeg risk. For stablecoin pairs, ask what happens to the position if one side trades at $0.92 for a week. The formula will happily compute a small loss while the underlying asset has repriced.
- Oracle and bridge risk. If the pool sits on another chain or prices off an external feed, ask who operates the feed and what happens when it lags or fails during volatility.
- Incentive decay. Ask how long the token rewards last and what happens to the headline rate when they stop. A reward-heavy pool can lose most of its quoted yield without any change in fee volume.
- All-in costs. Gas, swap fees, bridge fees, withdrawal fees, early-exit penalties and lockups all come out of the net result. A lockup that blocks withdrawal during a divergence converts a temporary loss into a realized one.
- Liquidation risk. If the strategy borrows against the LP position, ask at what price the collateral gets liquidated. Divergence and a loan against the position compound badly.
Reading risk labels correctly
Yield.ly shows observed risk labels built from evidence, and those labels are incomplete. Observed risk is not a safety guarantee, and a favorable label doesn't mean a pool can't lose money. The risk methodology page explains which inputs feed the assessment and where coverage stops. Where evidence is thin, the honest reading is "not enough history", not "low risk".
Crypto assets and DeFi protocols carry a substantial risk of loss, including losses that have nothing to do with the math in this article. Sequence risk, contract bugs and market structure failures all sit outside the formula.
Run Your Numbers Before You Deposit or Move
Six checks, run once, in this order.
- Price three scenarios. Compute impermanent loss at a modest move, a likely move, and a move that would hurt, using the formula rather than intuition.
- Convert to dollars on your actual amount. A 5.72% loss on $800 is $46. On $80,000 it's $4,576, and the second number changes how you feel about the position.
- Split the yield. Compare fee income against token rewards separately, and ask how long each is likely to last. Base APY and token reward APY are different promises.
- Subtract the full cost of the move. Gas, swap spread, bridge fees, exit costs and any early-exit penalty, across your real holding period, not a theoretical one.
- Confirm peg and liquidity conditions. Check the stablecoin's reserve backing or the pair's depth, and check any lockup that could trap you at the wrong moment.
- Check data freshness. A rate from last week isn't a rate today. Yield.ly shows a freshness state and observed timestamp per opportunity and won't treat stale or unavailable rates as investable, rather than filling gaps with a fabricated number.
The guide to what DeFi yield actually pays after gas and fees walks the cost side in more detail, and it's the step many skip.
Yield Alpha ranks a possible move as MOVE, STAY or WATCH in dollars rather than percentages. Net Yield Alpha subtracts labeled switching-cost estimates for exit, entry, gas, transfer time and early-exit penalty, so a move that looks like a gain on paper can rank as a WATCH once those costs come out. There's also a Discord for discussing yields with other readers if you want to pressure-test a position.
For education only, not financial or investment advice. Rates move and yield is never guaranteed; DeFi deposits can lose value. Yield is never guaranteed on any platform, and current APY annualizes today's conditions rather than promising them for your holding period.
Yield.ly is free and needs no account or wallet connection, and it displays base APY separately from token reward APY alongside TVL, seven-day TVL change and data freshness, so an impermanent-loss calculation can be paired with how durable the fee income looks. Start with Yield.ly to see the ranked board, then use Find My Yield Alpha to see MOVE, STAY or WATCH calls ranked in dollars after switching costs, including exit, entry, gas, transfer time and early-exit penalty estimates.