
On this page
Which pool pays you more, the one quoting 14% or the one quoting 6%? Neither number answers that on its own. One rate may be mostly a token giveaway that stops when the campaign budget runs out; the other may be trading fees from a pair that changes hands every few minutes.
Every pool APY is a claim assembled from parts: who pays it, how long they keep paying, and what it costs you to arrive and to leave. This guide takes the claim apart, starting with one swap against a shared pot of tokens and ending at the number you can plausibly keep. Every rate and dollar figure used here is hypothetical and labeled as such, because live yields move constantly.
Table of Contents
- What a Liquidity Pool Is and How Swaps Use It
- Where Pool Returns Come From and Who Pays Them
- How Pools Differ From Lending
- Reading Pool TVL, Volume and Active Depth
- Impermanent Loss Against Fee Income in Practice
- Reading Reported Yields Before You Trust Them
- Smart Contract, Oracle and Depeg Risks to Check
- Confirm the Net Return Before You Deposit
What a Liquidity Pool Is and How Swaps Use It
A liquidity pool is a shared pot of two tokens that anyone can trade against, and the people who deposit into it earn a cut of every trade. That's the core mechanism. Instead of matching a buyer with a seller through an order book, a pool prices each trade against the inventory it currently holds.
Picture a market stall that keeps both dollars and euros in one cash box. A traveler who wants euros drops dollars in and takes euros out, and the rate comes from how much of each currency is sitting in the box. A crypto pool does the same thing with two tokens and a formula standing in for the stallholder.
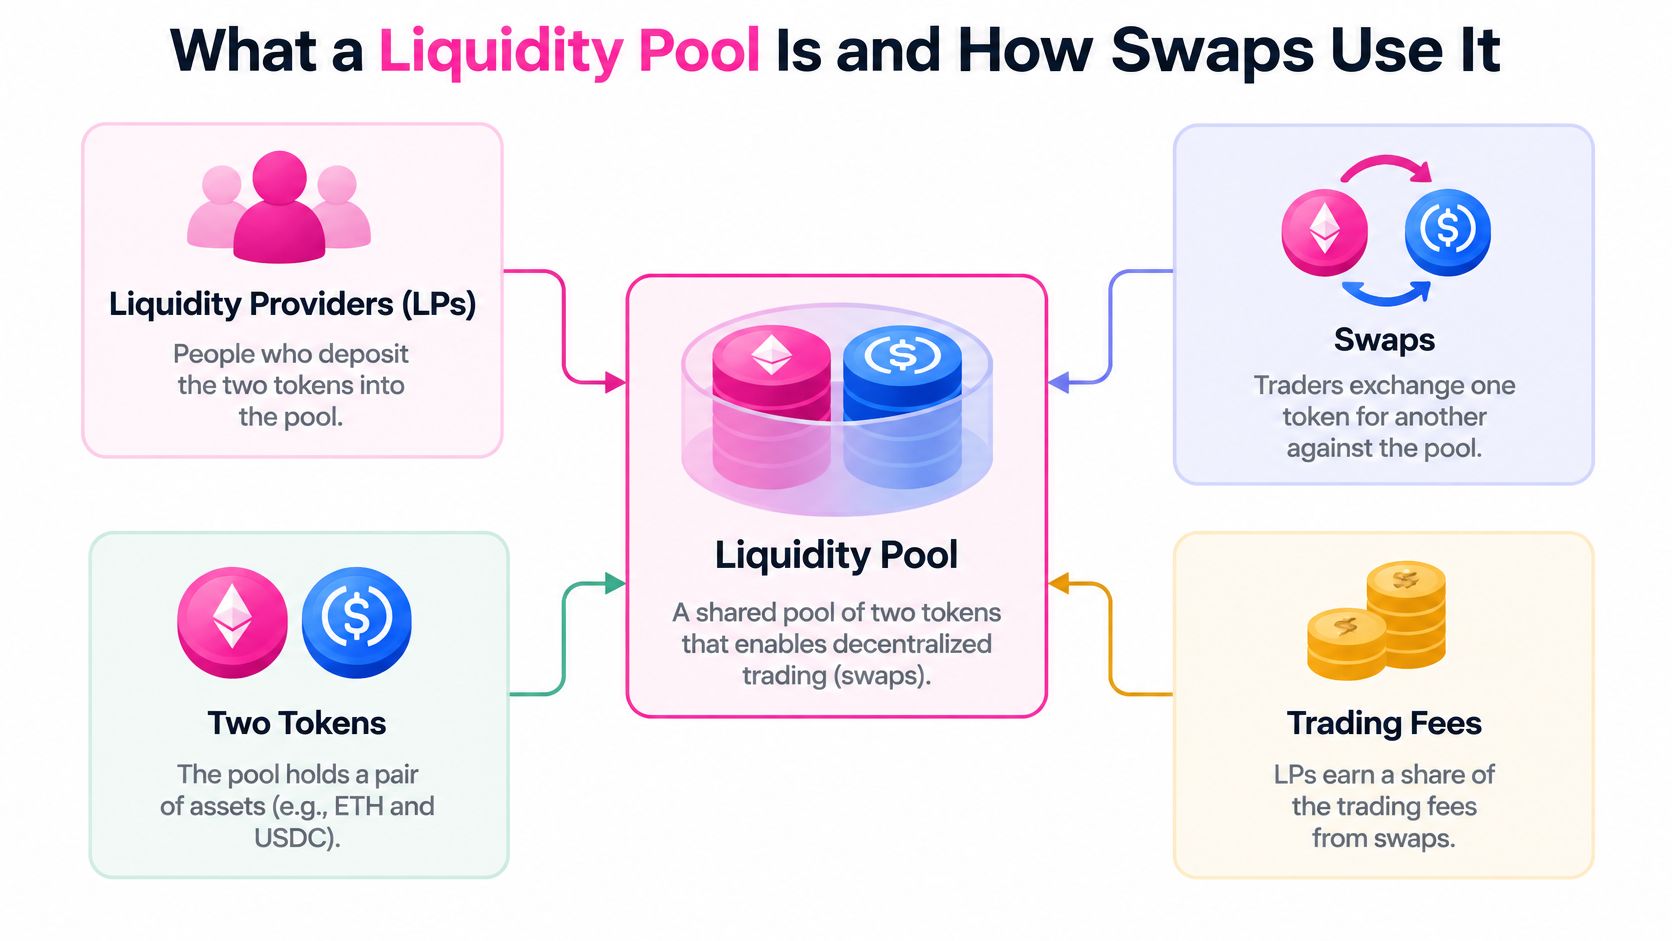
The deposit receipt is an LP token. When you add both assets, the pool mints a token that records your slice of the pot. It isn't a separate coin with its own price, it's a claim ticket. Burn it later and you withdraw your percentage of whatever the pool holds at that moment, which is usually a different mix of the two tokens than you deposited.
The formula that sets the price
Most pools use a constant product rule, written as x multiplied by y equals k, where the product of the two reserves holds steady as trades happen. A hypothetical pool holding 100 ETH and 200,000 USDC has k equal to 20,000,000 and an implied price of 2,000 USDC per ETH. A trader adds 10,000 USDC, so the USDC reserve becomes 210,000, and the ETH reserve has to fall to about 95.238 ETH to preserve k. The trader receives about 4.762 ETH, an average price near 2,100 USDC, as the constant product formula walkthrough sets out.
The gap between 2,000 and 2,100 is price impact, the same thing a trading interface calls slippage. It widens when the trade is large relative to the pool. This is the first place intuition breaks: a pool doesn't have a "real" price, only a price implied by its inventory, and every swap moves it.
Pool count is a weak substitute for depth. The OECD analysis of DeFi liquidity concentration found 159,252 liquidity pools deployed since Uniswap V2 launched and 11,031 in Uniswap V3 at the time of the report, yet across Uniswap V2 and Curve over their full histories, 90% of trading volume and transaction count sat in only about 40% to 60% of pools. Thousands of pools exist; a small subset does the work and collects the fees.
Most swaps don't stay inside one pool on one chain either. Routers split orders across several pools, and cross-chain routes settle through bridges, so the route matters as much as the destination; how intent-based bridging works explains a design where a solver fills an order from its own inventory instead of waiting for a message to cross chains.
Terms like TVL, APY and slippage get used loosely. The Yield.ly definitions page keeps short definitions in one place, and the Yield.ly Learn hub carries the longer guides.
Where Pool Returns Come From and Who Pays Them
A quoted pool rate is assembled from three sources, and one drain runs underneath all of them. Knowing which source is filling your number is the whole skill.
Trading fees are the only return the market pays for
Every swap pays a fee set by the pool's tier, often 0.30% on a standard tier and lower on pairs built for tight trading. That fee lands in the pool and is shared by LP token holders in proportion to their share. Fee yield is a function of volume divided by liquidity, multiplied by the fee rate, so the same pool can pay well one month and poorly the next with nothing changing except how much people trade.
Illustrative arithmetic. A pool with $1,000,000 of liquidity and $200,000 of daily volume at a 0.30% fee earns about $600 a day, which is roughly 22% a year against pool value before any cost. A $10,000 position is 1% of that pool and collects about $6 a day. Halve the volume and both figures halve. None of this is a forecast, it's the shape of the calculation.
Token rewards and points
Many pools add a second payment in a protocol's own token, and that reward APY gets quoted beside the fee APY even though it comes from a budget rather than from traders. Budgets run out, emissions get voted down, and reward rates get cut without warning. Points and partner campaigns are a third category, and their value isn't fixed until a claim happens. Programs that stack tokens on top of fee income are what people usually mean by yield farming, and yield farming explained for beginners covers how those campaigns are structured.
| Source | Who pays | How to measure it | Durability |
|---|---|---|---|
| Trading fees | Traders paying the pool fee tier | Fees earned over the period divided by position value | Tied to trading activity, varies with volume |
| Token incentives | Protocol or incentive program | Reward APY in the reward token | Often temporary, can end without notice |
| Points or partner rewards | Protocol or partner campaign | Not a fixed rate, value unknown until claimed | Usually temporary and hard to value |
| Impermanent loss (cost) | Market price moves that rebalance the pool | Gap between LP value and simply holding the same tokens | Ongoing whenever pooled prices diverge |
Fees aren't free money either. Research on automated market maker returns splits LP performance into market exposure plus a microstructural part, because the fees a pool accrues are partly paid back to arbitrageurs who trade after prices move elsewhere, and the loss-versus-rebalancing measure is proportional to price variance multiplied by the marginal liquidity in the pool. Higher volatility and deeper active liquidity raise the dollar cost of stale pricing even when volume looks strong.
The durability test: if reward APY is most of the headline figure, treat the rate as a campaign until it has survived at least one incentive cycle.
How Pools Differ From Lending
Someone who already supplies USDC to a lending market knows the shape of that trade. The useful comparison is where the income comes from and where the loss comes from.
One asset in, one asset out
Take a hypothetical 5,000 USDC in a lending market. The deposit joins a shared reserve, borrowers post collateral worth more than they borrow, and the supply rate rises and falls with how much of the reserve is out on loan. Payments come from borrower interest, so the question that decides your rate is borrowing demand. Your balance stays denominated in USDC, and a price split between two tokens can't touch it. The mechanics are documented in Aave's protocol documentation, which describes how supplies, borrows and the rate model interact.
The risks change shape rather than disappearing. Borrower collateral gets liquidated when prices fall, heavy borrowing can make withdrawals wait, and the oracle and the contract still have to work.
Two assets in, two assets out
The same 5,000 USDC in a pool becomes two assets, and the position earns trading fees plus any incentives. You withdraw a mix whose ratio has shifted with price.
- Income source: borrower interest in lending, trader fees in a pool.
- What moves the rate: utilization of the reserve versus turnover of the pool.
- Main loss path: borrower liquidation and withdrawal delay versus price divergence between the two pooled tokens.
A lending supply rate and a pool APY can print similar numbers while resting on completely different drivers.
The breakdown of DeFi vaults against lending pools goes further into how wrapper products change that picture.
Reading Pool TVL, Volume and Active Depth
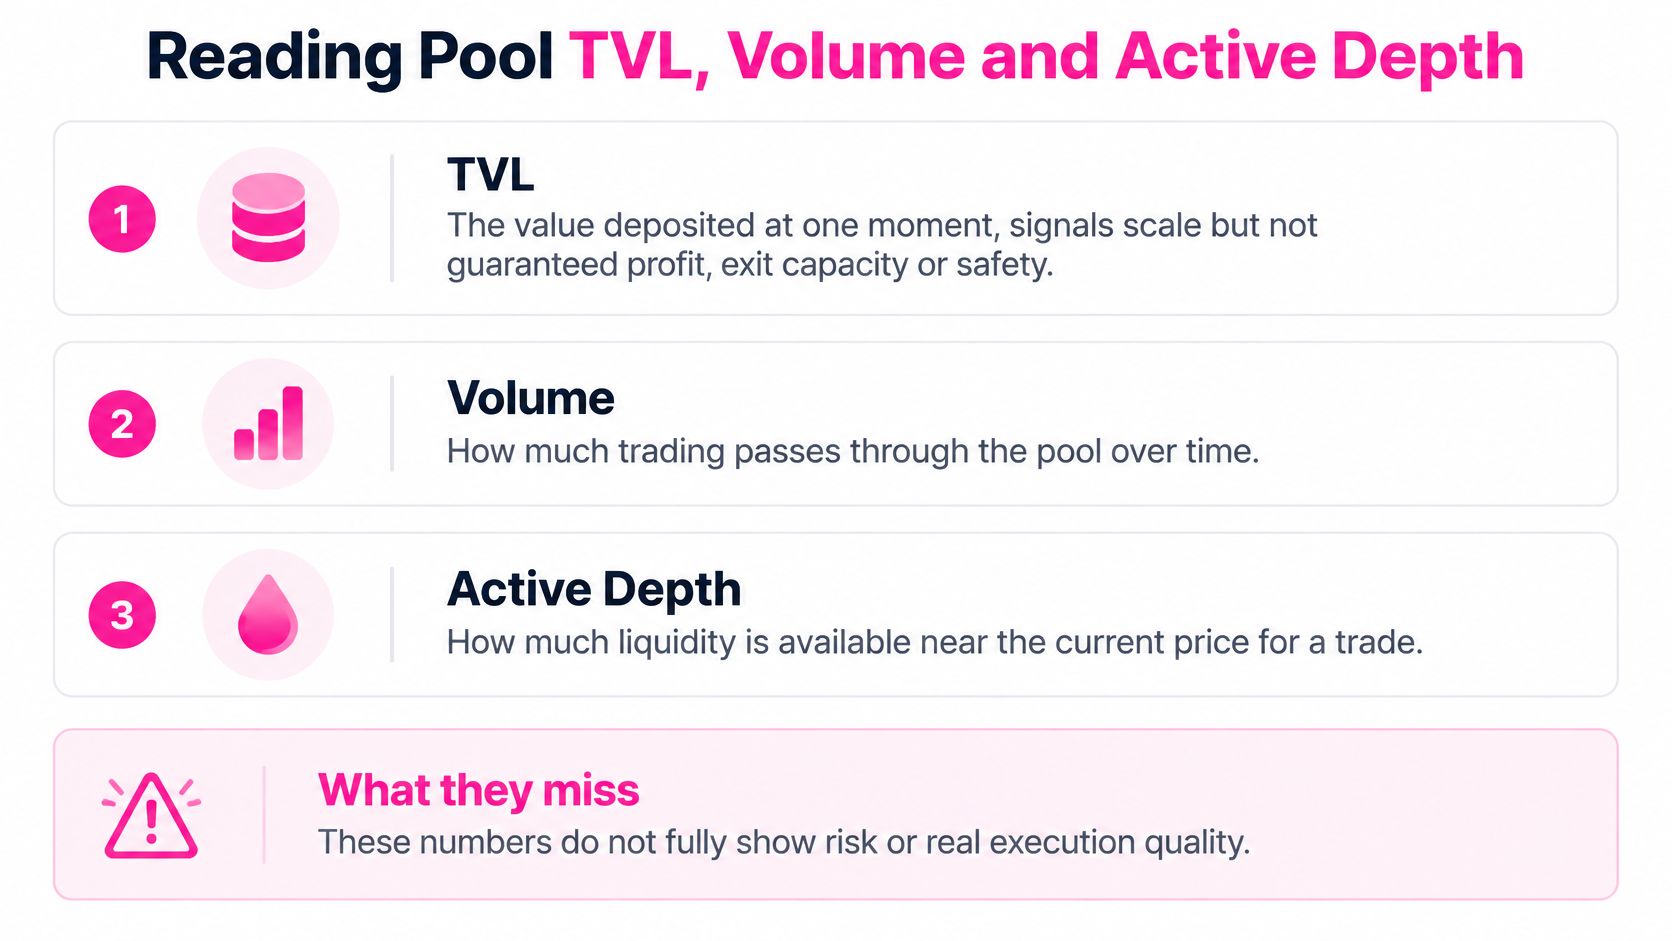
TVL is the value sitting in a pool at one moment. It signals scale, and it does not signal profit, exit capacity or safety. Capital can also be counted twice when the same deposit sits inside a wrapper that sits inside another protocol: a New York University Stern School of Business review of DeFi accounting found as much as $139.87 billion in duplicated TVL and a TVL-to-total-value-redeemable ratio near 2 in parts of the ecosystem, according to the Stern review of smart contracts and decentralized finance.
Volume is what generates fees, and the useful form is turnover: daily volume divided by TVL. A pool turning over 30% of its TVL each day produces fees roughly ten times faster than one turning over 3% at the same fee tier. 7-day TVL change shows whether capital is arriving or leaving, and the freshness timestamp tells you whether the numbers in front of you are hours old or weeks old.
Why the price range decides whether you earn
In a concentrated liquidity design, LPs choose a price interval instead of covering every price. Uniswap V3 divides prices into ticks, each one a 0.01% price step, and a position earns swap fees only while the market price sits inside the chosen boundaries. Uniswap's concentrated liquidity documentation notes that once price exits, the position generally stops earning fees and leans toward one asset, so the LP has to watch price location, gas costs and the odds of rebalancing. A stablecoin pair set to 0.99 to 1.01 is efficient while the peg holds and exposed the moment it doesn't.
The same job exists off Ethereum. Orca's concentrated liquidity overview describes a SOL/USDC provider recording the lower and upper price of the range, comparing the current SOL price to that band, and counting repositioning cost before treating a displayed fee APR as comparable with a full-range pool.
An APY quoted for a pool whose active range sits far from the current price isn't a rate you can realize. For how the two headline numbers relate, see APY versus TVL. Read four things before trusting any pool statistic:
- Active range: where the liquidity sits relative to the current price.
- Turnover: daily volume divided by TVL, the engine behind fee yield.
- 7-day TVL change: the direction capital is moving.
- Freshness: when the figures were last updated.
Impermanent Loss Against Fee Income in Practice
Every LP ends up in the same position when price moves, so watch what the position becomes.
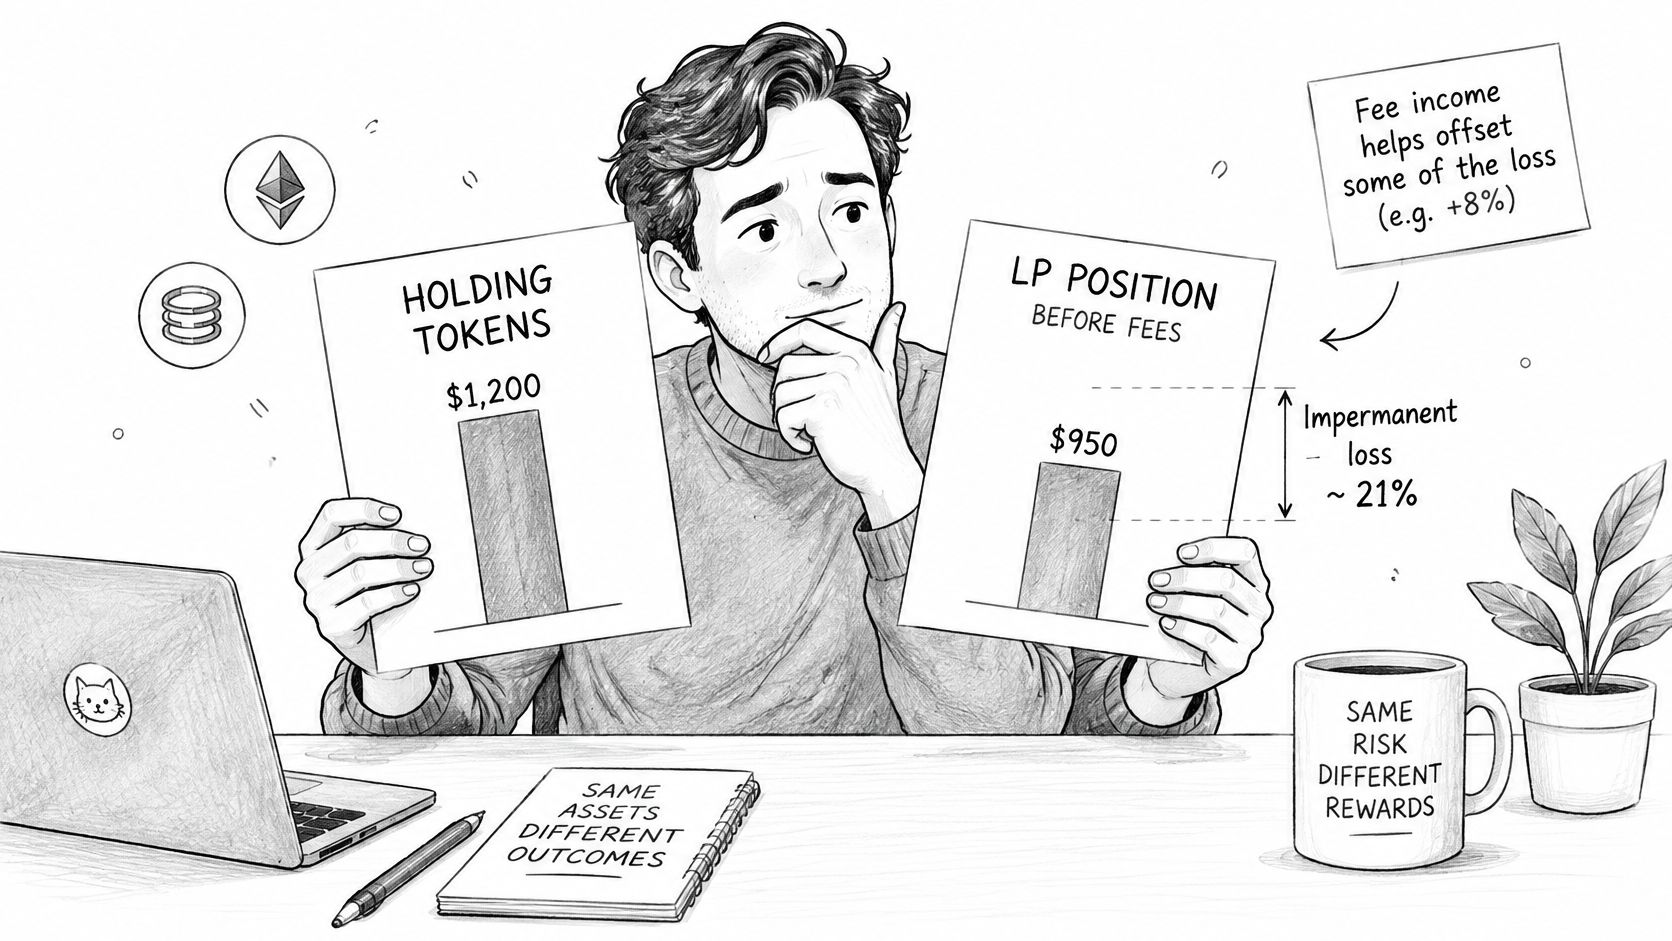
Impermanent loss is the gap between what a withdrawn position is worth and what the same tokens would be worth if they had stayed in a wallet, measured before fees and rewards. A separate guide covers it in depth. Here the point is narrower: that gap is the bill your trading fees have to clear.
A worked impermanent loss example runs like this. Deposit 1 ETH and 2,000 USDC when ETH is worth 2,000 USDC. If ETH doubles to 4,000 USDC, arbitrage rebalances the pool, and the numbers land as follows.
| Scenario | Value (USDC) |
|---|---|
| Hold 1 ETH and 2,000 USDC after ETH doubles to 4,000 USDC | 6,000 |
| LP position after arbitrage rebalance (about 0.7071 ETH and 2,828.43 USDC) | 5,656.85 |
| Gap before fees (about 5.7 percent) | 343.15 |
The loss isn't final while the position is open. If ETH falls back to 2,000 USDC, most of the gap closes, and fees keep accruing the whole time. That's why the label says impermanent, though nothing guarantees the price returns.
The break-even question is where most comparisons stop short. Fee income plus rewards has to exceed the price gap over your expected holding period. An impermanent loss explainer from CoinPaprika puts a doubling or halving in one token at roughly 5.72% relative loss versus holding and a fourfold move at about 20%, and estimates that a pool charging 0.30% needs daily volume equal to roughly 21.2% of pool value to offset the loss from a doubling over 90 days. Run the check in three lines:
- Fees over the holding period: daily fee rate multiplied by days held.
- The price gap at your expected path: what divergence costs at exit.
- Gas and exit costs: deposit, any rebalancing, and withdrawal.
A large pool with thin turnover fails this test. A smaller pool with heavy trading passes it. Size isn't the variable that decides.
Reading Reported Yields Before You Trust Them
A headline APY is a point-in-time, gross figure. It isn't what you keep, and on many days it isn't even what the pool paid last month.
- Split base from reward. If incentives make up most of the total, the rate depends on a program that can end at the next governance vote.
- Compare the 30-day average with the current figure. A rate that spiked three days ago hasn't been earned by anyone for a month.
- Add entry and exit costs. Gas on deposit, swap fees on both tokens, a bridge fee if the pool is on another chain, and gas on withdrawal.
- Check lockups and your exit size against depth. A withdrawal delay plus thin active liquidity can turn an orderly exit into a slow one.
- Model the drop. Ask what the position pays when the reward line goes to zero, then decide whether the base rate alone justifies the risk.
Hypothetical illustration. A $5,000 deposit at a 12% headline is $600 a year, split as 8 points of base yield ($400) and 4 points of reward yield ($200). Round-trip costs of $55 in gas and swaps leave about $545 if the whole rate holds. If the reward program ends, base fees of $400 minus $55 leaves about $345. That $55 is a 1.1% drag on the deposit, and the $200 gap between the two outcomes is the price of trusting a campaign you don't control.
Rates move for reasons you can inspect: turnover changes, incentive budgets shrink, and capital migrates toward the newest campaign, which is the dynamic behind why DeFi APY changes. Splitting the parts is the most useful habit here, and base APY versus reward APY covers the distinction in detail.
Yield.ly's opportunity tables put total APY next to base and reward figures, with a 30-day average APY, TVL, observed risk and a freshness timestamp, so the composition is visible before any comparison starts.
Smart Contract, Oracle and Depeg Risks to Check
One safety label can't cover a pool, because a pool is a contract plus a set of assets plus whatever feed prices them. Each piece fails in its own way.
Independent risk analysis separates impermanent loss, smart-contract risk, oracle risk and, for pools holding pegged assets, depeg risk, as Kaavon's research on market maker and liquidity provider risk sets out. The categories matter because they fail on different triggers and get checked in different places.
Reported losses cluster in exactly those areas. A loss summary cited in 1inch's guide to crypto liquidity pools attributed 48.9% of reported losses to bridge and peg-verification failures and 21.7% to oracle or price manipulation involving illiquid collateral.
| Risk | What triggers it | Check before depositing |
|---|---|---|
| Smart contract | Bug or exploit in the pool code | Audit reports, contract age, live history and official protocol docs |
| Oracle | Manipulated or stale price feed used by the protocol | Which price feed is used and how often it updates |
| Depeg | Pooled stablecoin or pegged asset trades off its peg | Issuer, redemption terms and how much of the pool is pegged |
| Bridge or wrapper | Bridge failure or mismatch between wrapped and original asset | Bridge design, wrapper issuer and whether the wrapper can be redeemed |
| Issuer or counterparty | Issuer freezes, fails or cannot redeem | Issuer disclosures and regulator pages for the stablecoin |
An audit is a starting point, not a certificate. It describes code that someone read, not how the pool behaves next month.
A large TVL, a clean audit and a high rate are three separate claims, and none of them is a safety guarantee. The Yield.ly methodology explains how qualification and observed risk are assessed, and the risk methodology page sets out what the observed-risk label does and doesn't claim. Observed risk is evidence-based, not a promise.
The practical habit is to check the specific pool contract and its specific assets rather than the protocol brand. Two pools on the same protocol can share a name and hold entirely different collateral, wrappers and price feeds.
Confirm the Net Return Before You Deposit
The decision stays yours, and it comes down to four confirmations: net return after every cost, the share of the total that depends on rewards, active depth for your trade size, and the non-price risks attached to that exact contract.
Work the numbers on a hypothetical pool quoting 12% APY, split as 4% from swap fees and 8% from reward tokens. Say entering costs 0.6% of the deposit in gas and price impact, and leaving costs another 0.6%. Over a three-month hold the quoted rate pays roughly 3%, the round trip takes about 1.2% of the deposit, and two-thirds of the quote comes from the least durable part. The real test is whether the 4% fee share alone still clears the switching cost. The guide to DeFi yield after gas fees runs through that subtraction step by step.
This is education, not a recommendation about where to put capital. Nobody can promise a pool keeps paying, and a deposit can come back smaller than it went in.
Yield.ly is free to browse with no account and no wallet connection. It doesn't hold funds or execute trades, and it functions as a research tool rather than financial advice. The compare view sets pool rates side by side so the four confirmations sit on one screen.
For education only, not financial or investment advice. Rates move and yield is never guaranteed; DeFi deposits can lose value.
Yield.ly is a free crypto yield intelligence tool that ranks qualified opportunities by yield quality, liquidity, observed risk and data confidence instead of headline APY alone, which is the comparison this whole article keeps asking for. Browse the ranked tables at Yield.ly to see base APY split from token reward APY, with TVL and 7-day TVL change beside each listing, and no wallet needed. Then use Find My Yield Alpha to rank MOVE, STAY or WATCH moves in dollars after switching costs, so a pool that only looks better stops being treated as one.